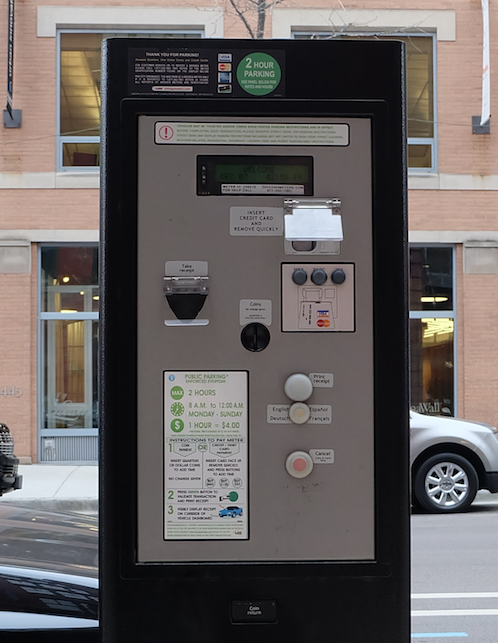
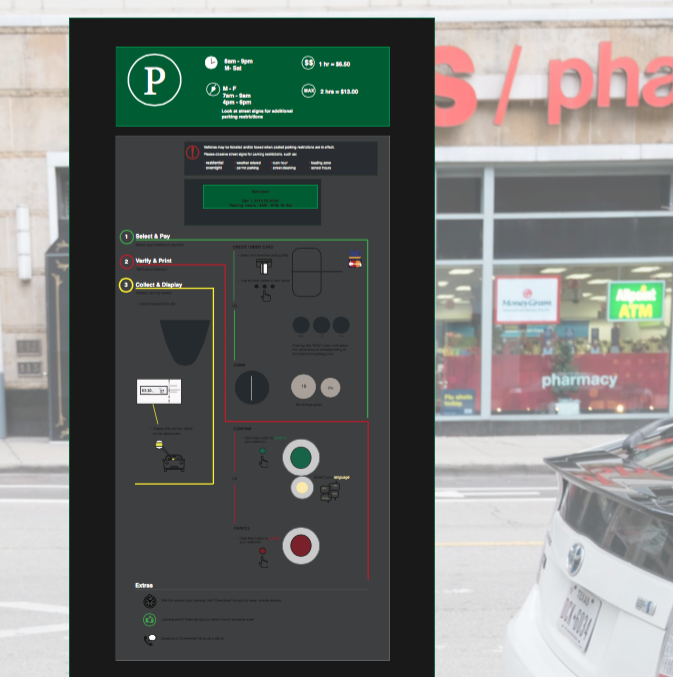
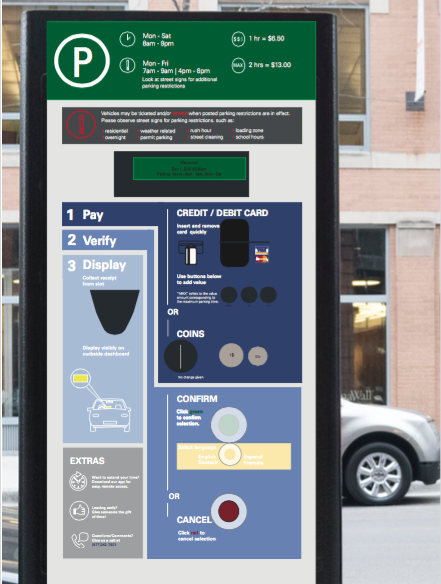
This project was focused on redesigning the structure of information on Chicago parking meters. The process entailed observing users to identify use patterns, user pain points and opportunities for improvement, such as categorizing information into " quick summary" vs " detailed instructions".
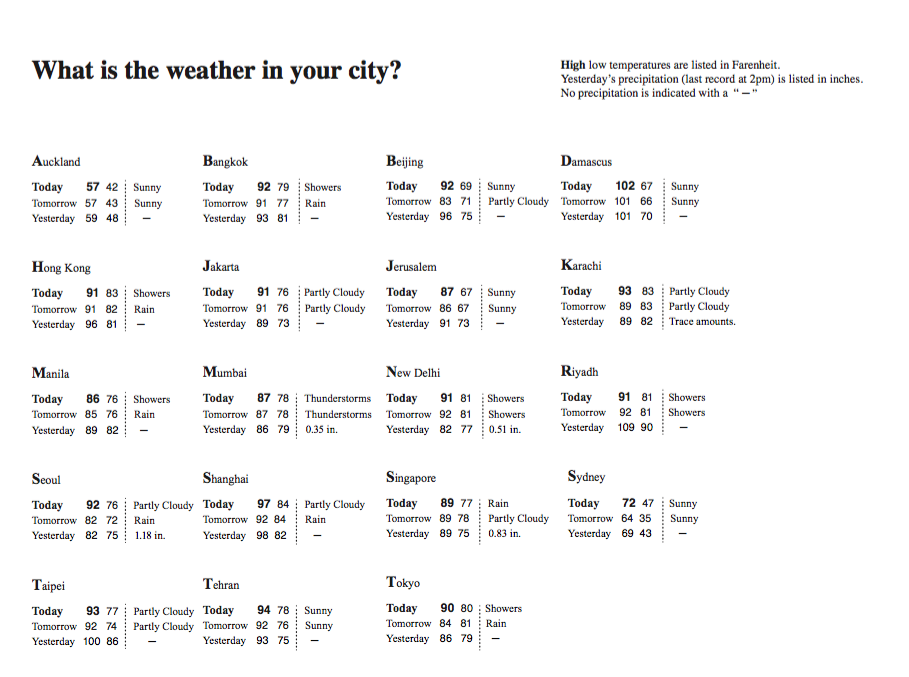
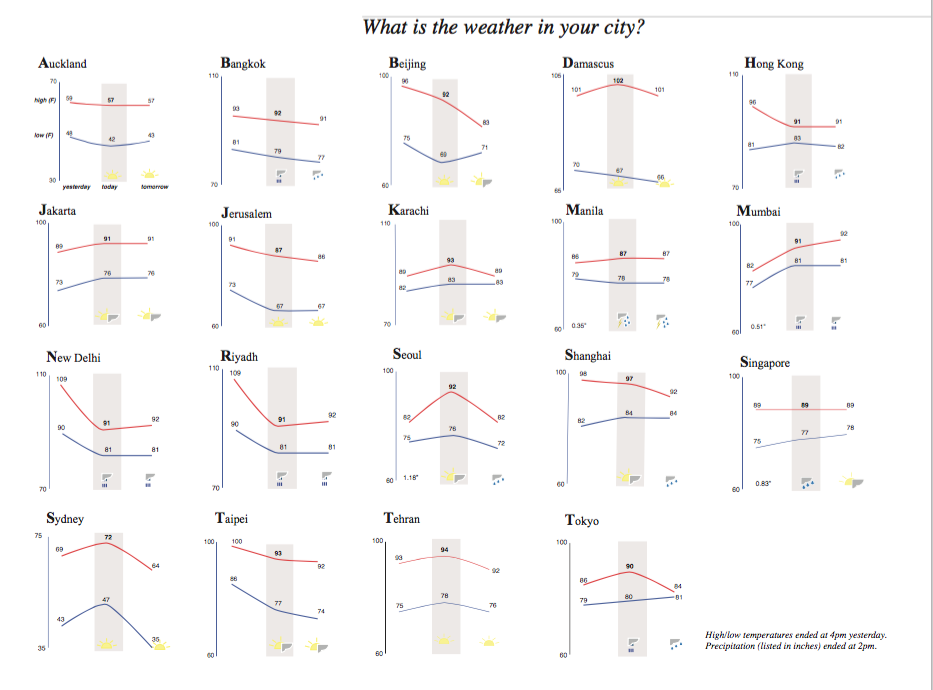
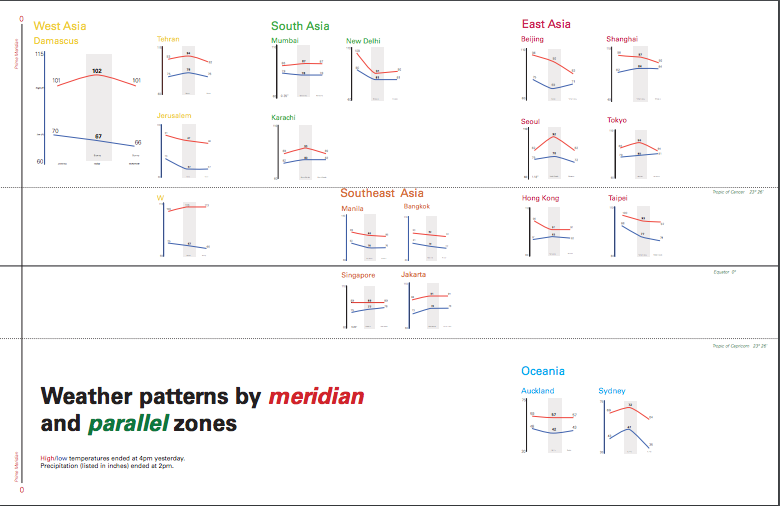
In the following project, I explored innovative and fun ways to visualize weather data, from text tiles to bar graphs to geographical locations.
I was tasked with creating a digestible diagram that highlighted the events following the BP oil spill, with a special emphasis on clean up efforts. Below is my attempt at tackling this.

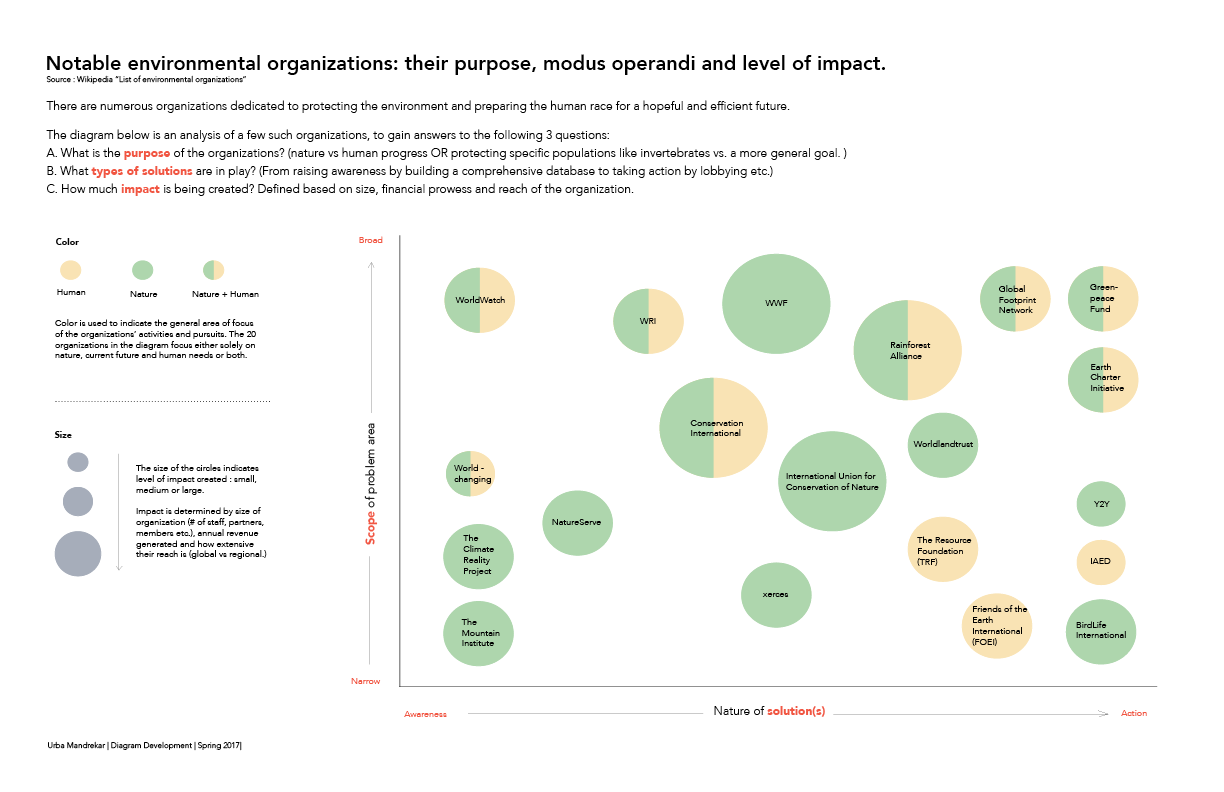
For this project, I was given data on different environmental organizations and asked to organize them in a meaningful manner, based on their similarities and/or differences.

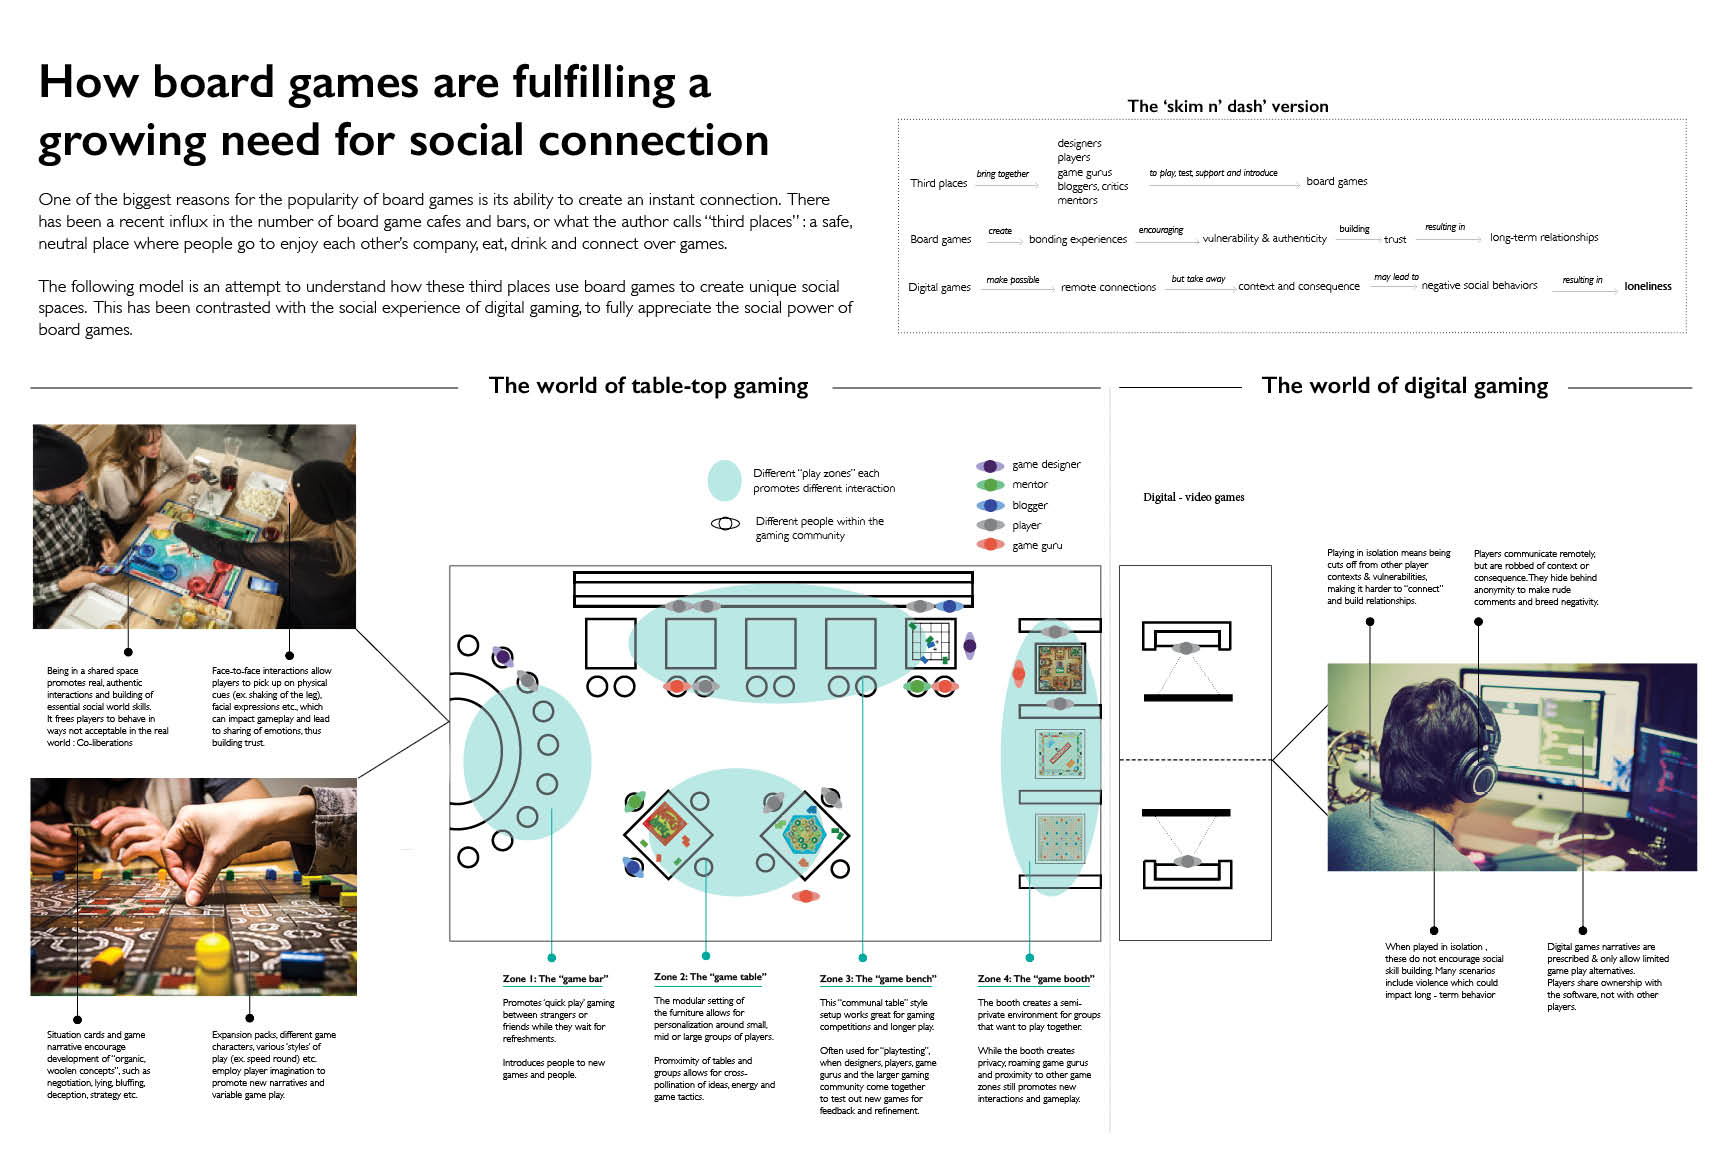
The following is an illustration of the growing role of board games as social lubricants in society. Content is based off of David Sax's book "Revenge of the Analog"

A new proposed model of innovation, to improve access and quality of mental health care in the city, utilizing city-wide resources and stakeholders (specialized clusters) to build partnerships.